VS-SMOTE (VSSMOTE, 2025)
VSSMOTE.RdResampling with VSSMOTE.
Arguments
- x
feature matrix or data.frame.
- y
a factor class variable. Can have more than two classes.
- k
number of nearest neighbors of the class that each sample is linked to (connecting lines) and size of the neighborhood of the middle points. Default is 5.
- k1, k2
a connecting line is used if the number of samples of the class among the
knearest neighbors of its middle point is betweenk1andk2(high-value space).k1 = 0andk2 = k(default) give the ordinary SMOTE. Raisingk1removes lines in majority dominated (noisy) spaces, loweringk2removes lines in the safest spaces. IfNULL,k2isk.- ovRate
Oversampling rate. Class \(j\) receives
round(ovRate * (n_max - n_j))synthetic samples, wheren_maxis the size of the largest class (halves are rounded up). Default is 1 meaning full balance. A vector with one value per class is also accepted.- ...
not used.
Value
a list with resampled dataset.
- x_new
Resampled feature matrix.
- y_new
Resampled target variable.
- x_syn
Generated synthetic feature data.
- y_syn
Generated synthetic label data.
Details
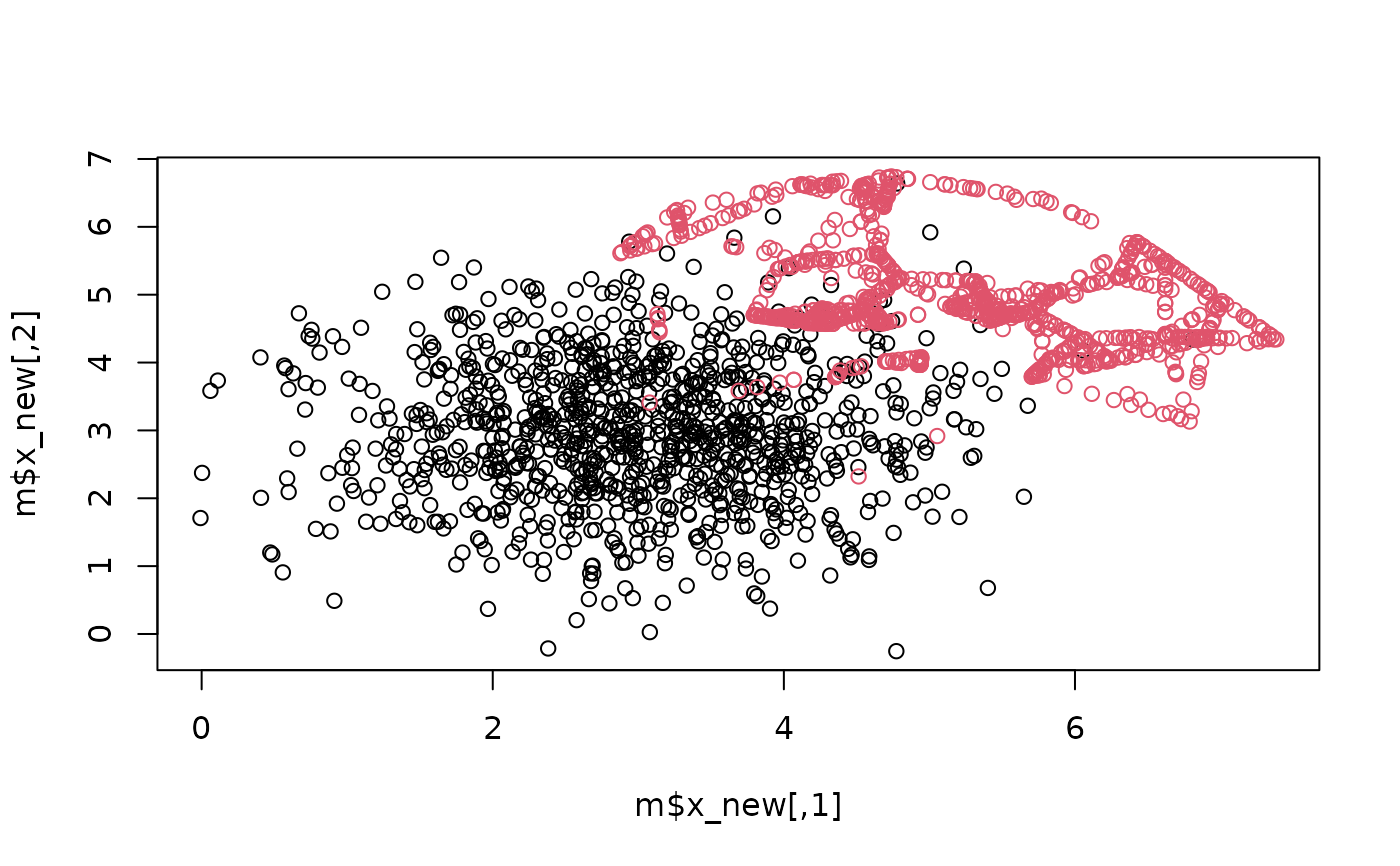
Year: 2025. Each sample is linked to its k nearest neighbors of the class. The middle point of every connecting line is used to judge the space of the line, and synthetic samples are generated uniformly along randomly chosen lines of the high-value spaces only. If no line qualifies, all lines are used with a warning.
Can work with classes more than 2: every class is oversampled against the union of the other classes (one-versus-rest).
References
Qiu, F., Yang, F., Xiong, Y., Chen, T., Xiao, P., Zheng, W., ... & Zhou, K. (2025). VS-SMOTE: Leveraging high-value spaces to balance noise control and data diversity for class imbalanced learning. Neurocomputing, 131321.
Examples
set.seed(1)
x <- rbind(matrix(rnorm(2000, 3, 1), ncol = 2, nrow = 1000),
           matrix(rnorm(100, 5, 1), ncol = 2, nrow = 50))
y <- as.factor(c(rep("negative", 1000), rep("positive", 50)))

m <- VSSMOTE(x = x, y = y, k = 5, k1 = 2, k2 = 5)
table(m$y_new)
#>
#> negative positive
#>     1000     1000
plot(m$x_new, col = m$y_new)